4 minutes
Introduction to leaflegend
leaflegend is a package to extend the customization of legends for the
leaflet package in R. The addLegend
function provides some great out of the box legends based on the internal
palette functions, but styling of the legend components has to be done with
external css code as in this
example.
leaflegend allows the user to add images to legends,
style the labels of the legend items, change orientation of the legend items,
use different symbologies, and style axis ticks. Syntax and style is consistent with the leaflet package
to lower the mental overhead for new users and the legends are outputs from
leaflet::addControl to ensure interoperability.
Custom Images in Legends
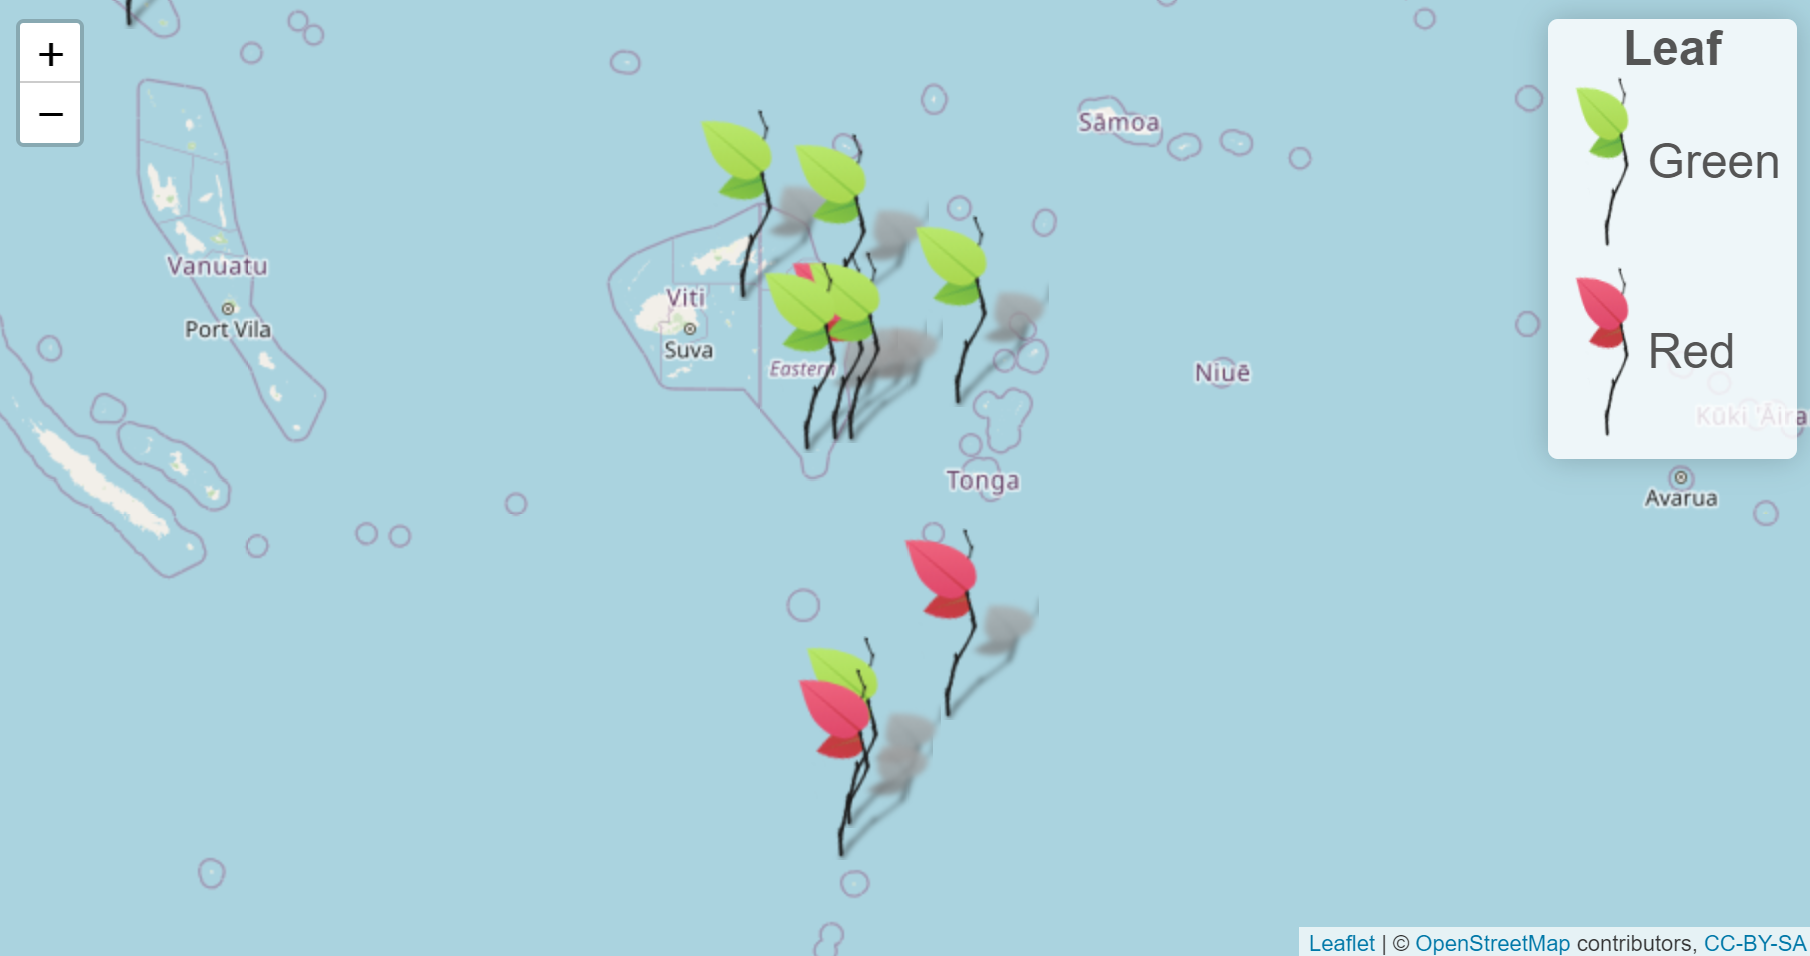
Image files already are supported for mapping using the icon series of
functions per documentation.
addLegendImage accepts png, jpg, and
svg data URIs and
encodes and embeds them into the legend.
library(leaflet)
library(leaflegend)
data("quakes")
# from https://rstudio.github.io/leaflet/markers.html
quakes1 <- quakes[1:10,]
leafIcons <- icons(
  iconUrl = ifelse(quakes1$mag < 4.6,
                   "http://leafletjs.com/examples/custom-icons/leaf-green.png",
                   "http://leafletjs.com/examples/custom-icons/leaf-red.png"
  ),
  iconWidth = 38, iconHeight = 95,
  iconAnchorX = 22, iconAnchorY = 94,
  shadowUrl = "http://leafletjs.com/examples/custom-icons/leaf-shadow.png",
  shadowWidth = 50, shadowHeight = 64,
  shadowAnchorX = 4, shadowAnchorY = 62
)

leaflet(data = quakes1, width = '100%') %>% addTiles() %>%
  addMarkers(~long, ~lat, icon = leafIcons) %>%
  addLegendImage(images = c("http://leafletjs.com/examples/custom-icons/leaf-green.png",
                            "http://leafletjs.com/examples/custom-icons/leaf-red.png"),
                 labels = c('Green', 'Red'),width = 38, height = 95,
                 orientation = 'vertical',
                 title = htmltools::tags$div('Leaf',
                                             style = 'font-size: 24px; text-align: center;'),
                 position = 'topright')

Creating SVG Map Symbols
A helper function is provided to create svg data URIs for commonly used symbols
– rect, circle, triangle, plus, cross, star and stadium. Beyond the named
arguments for styling the symbol, you can use ... to pass arguments to
modify the svg. I would recommend taking a look at MDB Web Docs
to see all the available options.
redx <- makeSymbol('cross', width = 100, height = 100, color = 'black', fillColor = 'red',
           opacity = .7, fillOpacity = .5)
htmltools::img(src = redx)
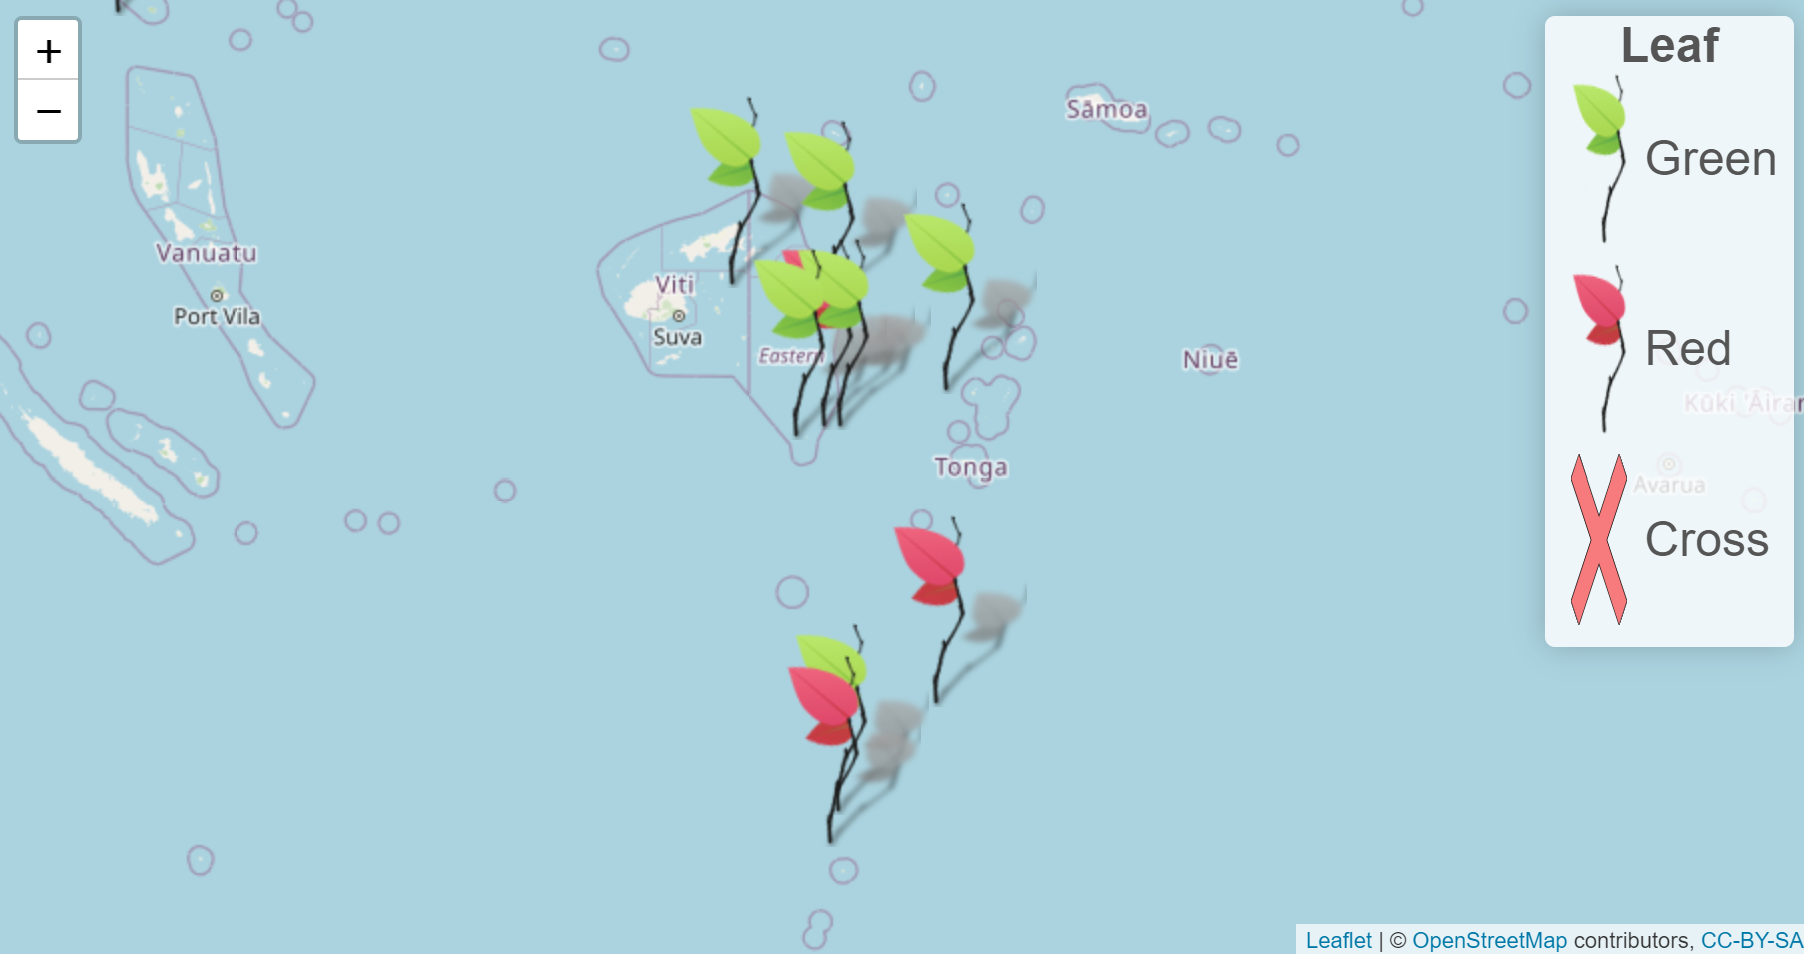
Images on disk can be mixed with the symbols and displayed. To make your own
symbol, create a character string with data:image/svg+xml,<svg>...</svg> and
add the class ‘svgURI’.
leaflet(data = quakes1, width = '100%') %>% addTiles() %>%
  addMarkers(~long, ~lat, icon = leafIcons) %>%
  addLegendImage(images = list("http://leafletjs.com/examples/custom-icons/leaf-green.png",
                               "http://leafletjs.com/examples/custom-icons/leaf-red.png",
                               redx),
                 labels = c('Green', 'Red', 'Cross'),
                 width = c(38, 38, 40),
                 height = c(95, 95, 40),
                 orientation = 'vertical',
                 title = htmltools::tags$div('Leaf',
                                             style = 'font-size: 24px; text-align: center;'),
                 position = 'topright')

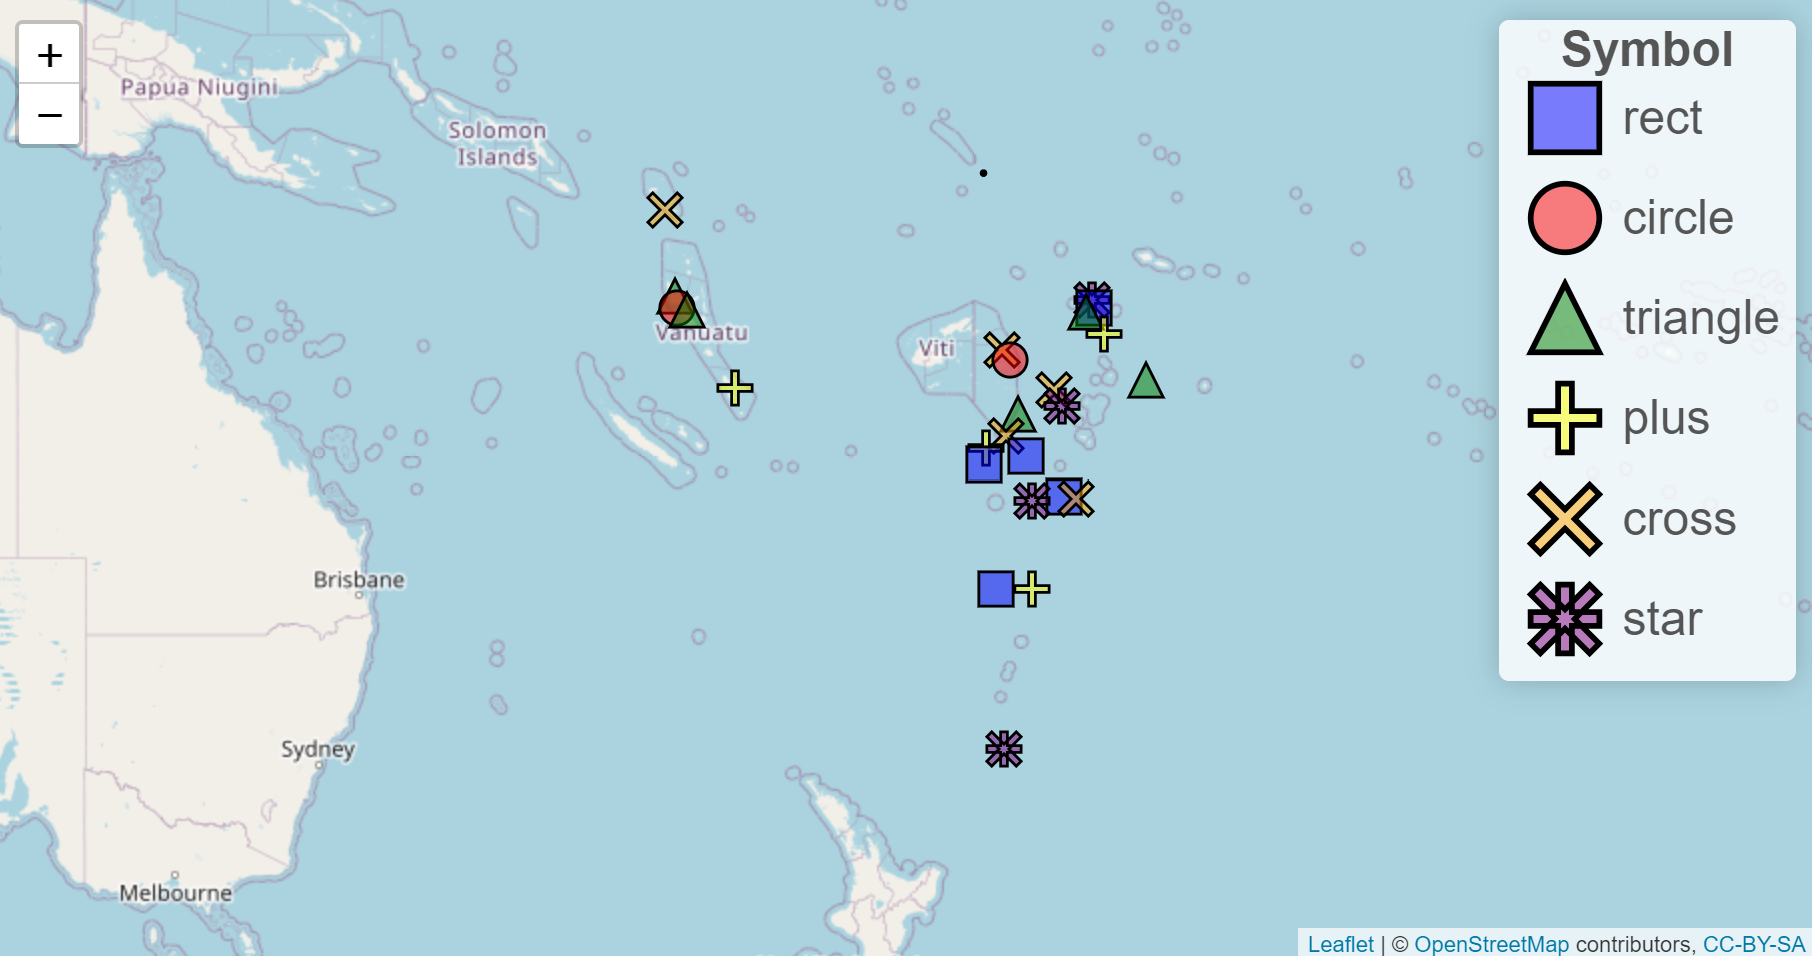
The map symbols can be used on leaflet maps as well. Create a list of the items and create them as icons as you would for image files or from icon libraries.
shapes <- c('rect', 'circle', 'triangle', 'plus', 'cross', 'star')
symbols <- setNames(Map(f = makeSymbol
               ,shape = shapes
               ,fillColor = c('blue', 'red', 'green', 'yellow', 'orange', 'purple')
               ,color = 'black'
               ,opacity = 1
               ,fillOpacity = .5
               ,height = 24
               ,width = 24
               ,'stroke-width' = 2), shapes)
quakes[['symbol']] <- sample(shapes, nrow(quakes), replace = TRUE)

leaflet(data = quakes[sample(seq_len(nrow(quakes)), 25),], width = '100%') %>% addTiles() %>%
  addMarkers(
    ~ long,
    ~ lat,
    icon = ~ icons(
      iconUrl = symbols[symbol],
      iconWidth = 20,
      iconHeight = 20
    )
  ) %>%
  addLegendImage(
    images = symbols,
    labels = shapes,
    width = 50,
    height = 50,
    orientation = 'vertical',
    title = htmltools::tags$div('Symbol',
                                style = 'font-size: 24px; text-align: center;'),
    position = 'topright'
  )

Update: Requires leaflegend >= 1.0.0
shapeColorPal <- colorFactor(c('blue', 'red', 'green',
                               'yellow', 'orange', 'purple'),
                             shapes)
leaflet(data = quakes[sample(seq_len(nrow(quakes)), 25),], width = '100%') %>%
  addTiles() %>%
  addSymbols(
    lng = ~long,
    lat = ~lat,
    values = ~symbol, color = 'black',
    fillColor = ~shapeColorPal(symbol),
    fillOpacity = .5,
    width = 24,
    height = 24
  ) %>%
  addLegendSymbol(
    pal = shapeColorPal,
    values = ~symbol,
    color = 'black',
    fillOpacity = .5,
    width = 50,
    height = 50,
    orientation = 'vertical',
    title = htmltools::tags$div('Symbol',
                                style = 'font-size: 24px; text-align: center;'),
    position = 'topright'
  )
Customizing Leaflet Legends with Palettes
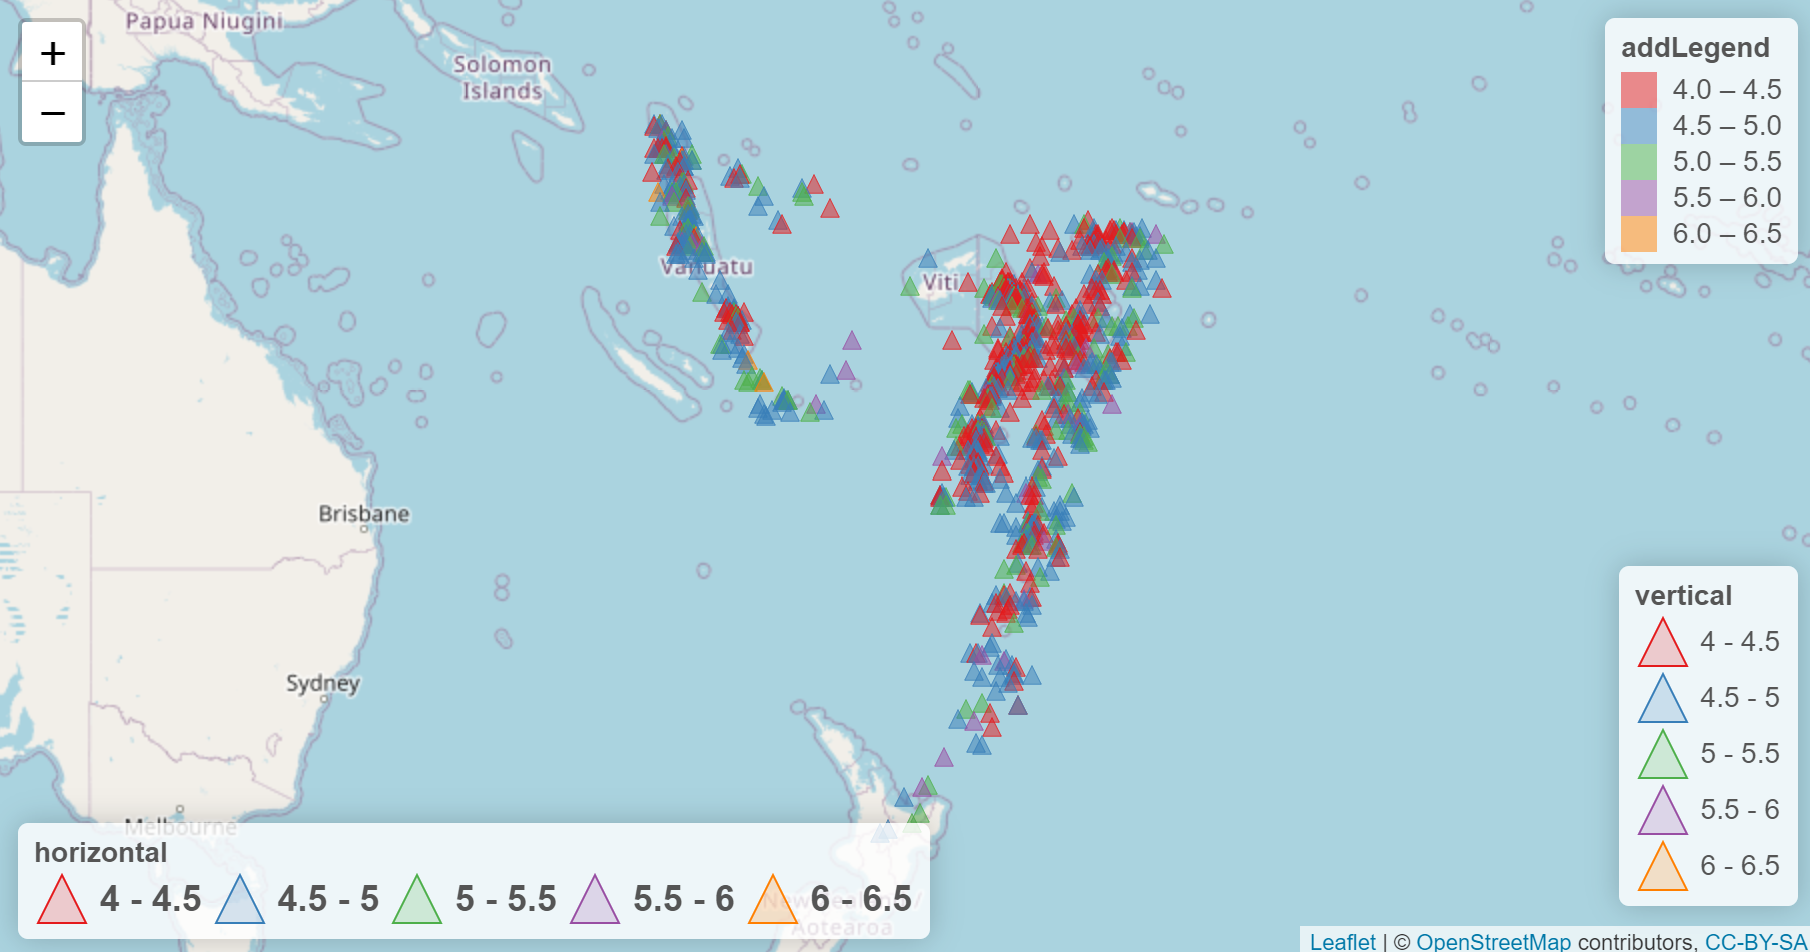
The addLegend* functions take palettes generated from the leaflet package
and uses them to create legends with greater flexibility. For instance,
using differently symbology for points is possible by specifying a
different shape. You can control the opacity of the outline and fill so that
it matches what is displayed on the map. Position the legend elements to
be horizontal or vertical and control the text styling of the title and the
label elements.
binPal <- colorBin('Set1', quakes$mag)
symbols <- lapply(binPal(quakes$mag)
                  ,makeSymbol
                  ,shape = 'triangle'
                  ,opacity = 1
                  ,fillOpacity = .5
                  ,height = 24
                  ,width = 24
                  ,'stroke-width' = 1)
leaflet(width = '100%') %>%
  addTiles() %>%
  addMarkers(
    data = quakes,
    lat = ~ lat,
    lng = ~ long,
    icon = ~icons(
      iconUrl = symbols,
      iconWidth = 10,
      iconHeight = 10
    )
  ) %>%
  addLegendBin(
    pal = binPal,
    values = quakes$mag,
    position = 'bottomleft',
    title = 'horizontal',
    shape = 'triangle',
    opacity = 1,
    fillOpacity = .2,
    labelStyle = 'font-size: 18px; font-weight: bold;',
    orientation = 'horizontal',
    layerId = 'horizontal'
  ) %>%
  addLegendBin(
    pal = binPal,
    values = quakes$mag,
    position = 'bottomright',
    title = 'vertical',
    shape = 'triangle',
    opacity = 1,
    fillOpacity = .2,
    orientation = 'vertical',
    layerId = 'vertical'
  ) %>%
  addLegend(pal = binPal,
            values = quakes$mag,
            title = 'addLegend',
            layerId = 'addLegend')

