4 minutes
Map Symbols and Size Legends for leaflet
Requires leaflegend >= 1.0.0
The leaflet package in R has built-in functionality for creating color
encoded geometries and annotating with color legends. Support is lacking in the
area of providing the ability to encode data with sizes or symbology except for
the case of circle markers. Size and symbology are an important part of
data visualization on a map. Using the leaflegend package, you can add both
to your leaflet maps without adding external css or javascript.
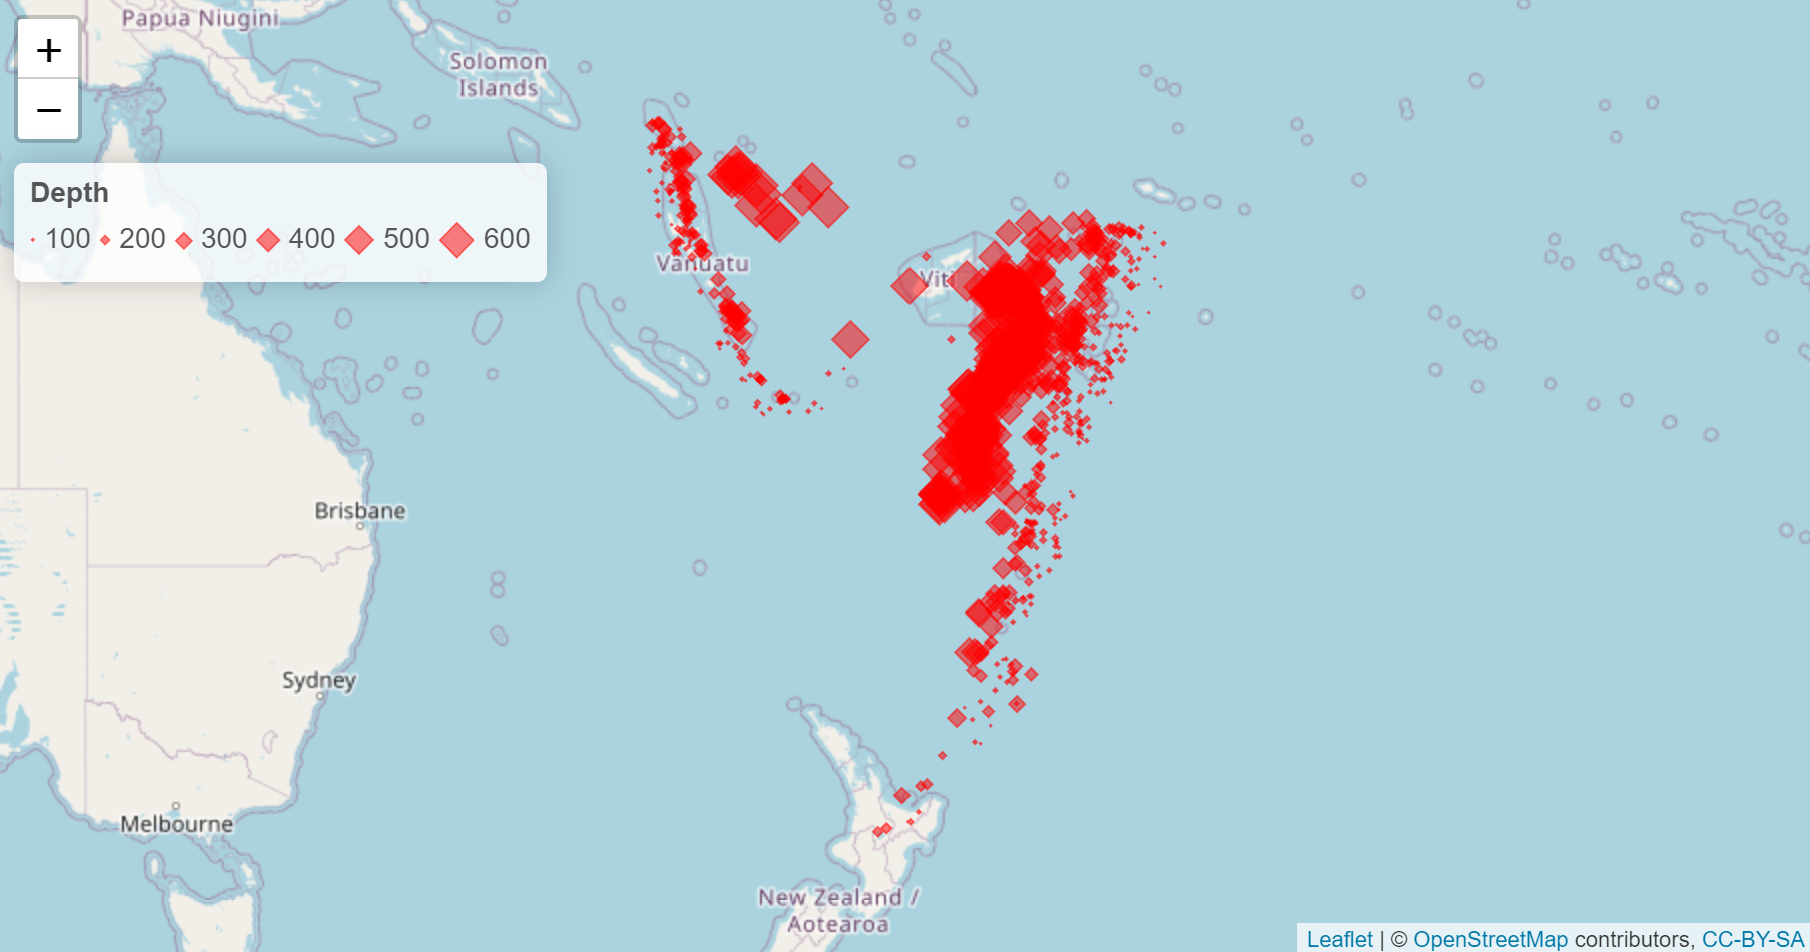
Adding Proportional Sizing to Symbols
To create the appropriately sized symbols, The makeSymbolsSize function can
create a list of icons based on the output of sizeNumeric. The baseSize
argument sets the center point size of the data scale to the mean of the values
e.g. with values 1, 2, 3, 4, 5 and a base size of 10, the resultant size in
pixels of the symbols are 3.33, 6.67, 10, 13.33, 16.67. The symbols can be
added as icons to the map since they are svg elements. Some transparency is
added here to show overlapping symbols.
To add a legend for the sizes, addLegendSize takes in the same values and uses
the pretty function and breaks argument to create the scale. There may be some
inconsistency between the number of breaks specified (leaflet internals also
make use of the pretty function). It is easy to customize other aspects of the
legend for appearance such as here: the color, symbol, and transparency are
matched to the symbols and we align the legend items horizontally.
library(leaflet)
library(leaflegend)
data("quakes")
symbols <- makeSymbolsSize(
  values = quakes$depth,
  shape = 'diamond',
  color = 'red',
  fillColor = 'red',
  opacity = .5,
  baseSize = 10
)
leaflet() %>%
  addTiles() %>%
  addMarkers(data = quakes,
             icon = symbols,
             lat = ~lat, lng = ~long) %>%
  addLegendSize(
    values = quakes$depth,
    color = 'red',
    fillColor = 'red',
    opacity = .5,
    title = 'Depth',
    shape = 'diamond',
    orientation = 'horizontal',
    breaks = 5)
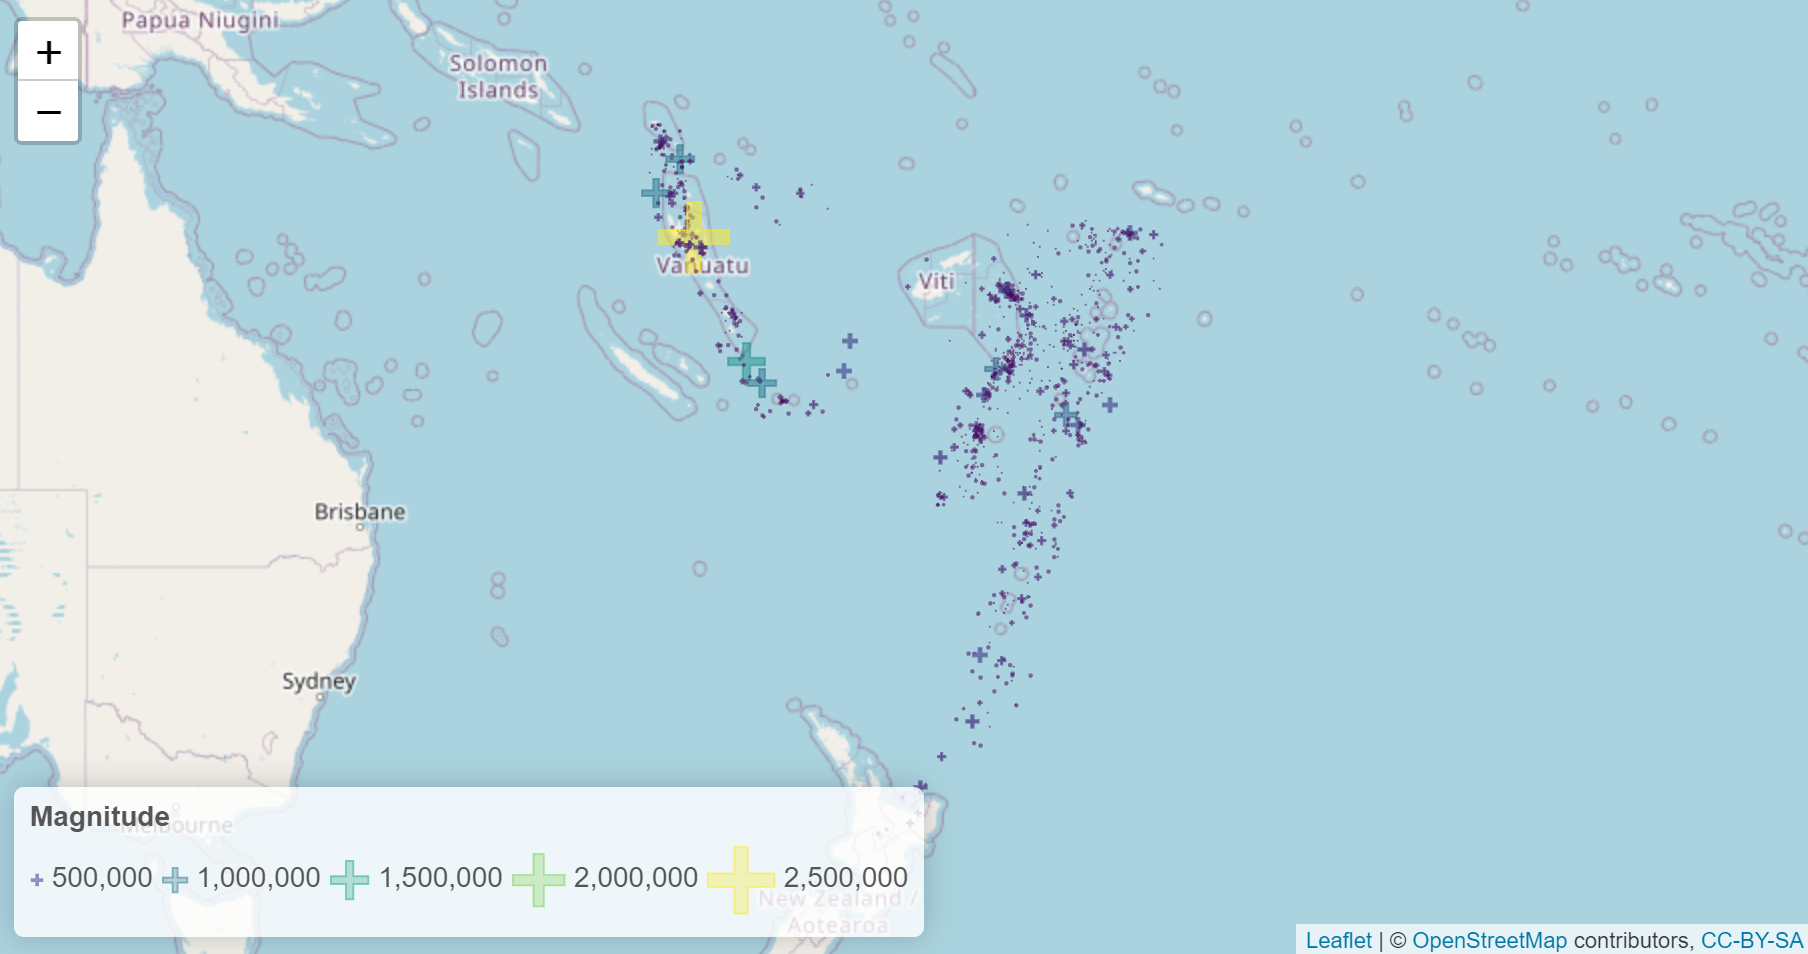
Encoding Color and Size
A helper function addSymbolsSize simplifies the above code and one can use
a palette to generate colors. The symbols are switched to a plus sign to
provide a smaller impact of area for overlapping points. The result is called
double-encoding and is a way to emphasize differences in data. Because
the Richter scale is on a logarithmic scale, the actual reading
of magnitude was taken as ten to the power of.
numPal <- colorNumeric('viridis', 10^(quakes$mag))
leaflet(quakes) %>%
  addTiles() %>%
  addSymbolsSize(values = ~10^(mag),
                 lat = ~lat,
                 lng = ~long,
                 shape = 'plus',
                 color = ~numPal(10^(mag)),
                 fillColor = ~numPal(10^(mag)),
                 opacity = .5,
                 baseSize = 1) %>%
  addLegendSize(
    values = ~10^(mag),
    pal = numPal,
    title = 'Magnitude',
    baseSize = 1,
    shape = 'plus',
    orientation = 'horizontal',
    opacity = .5,
    fillOpacity = .3,
    position = 'bottomleft',
    breaks = 5)
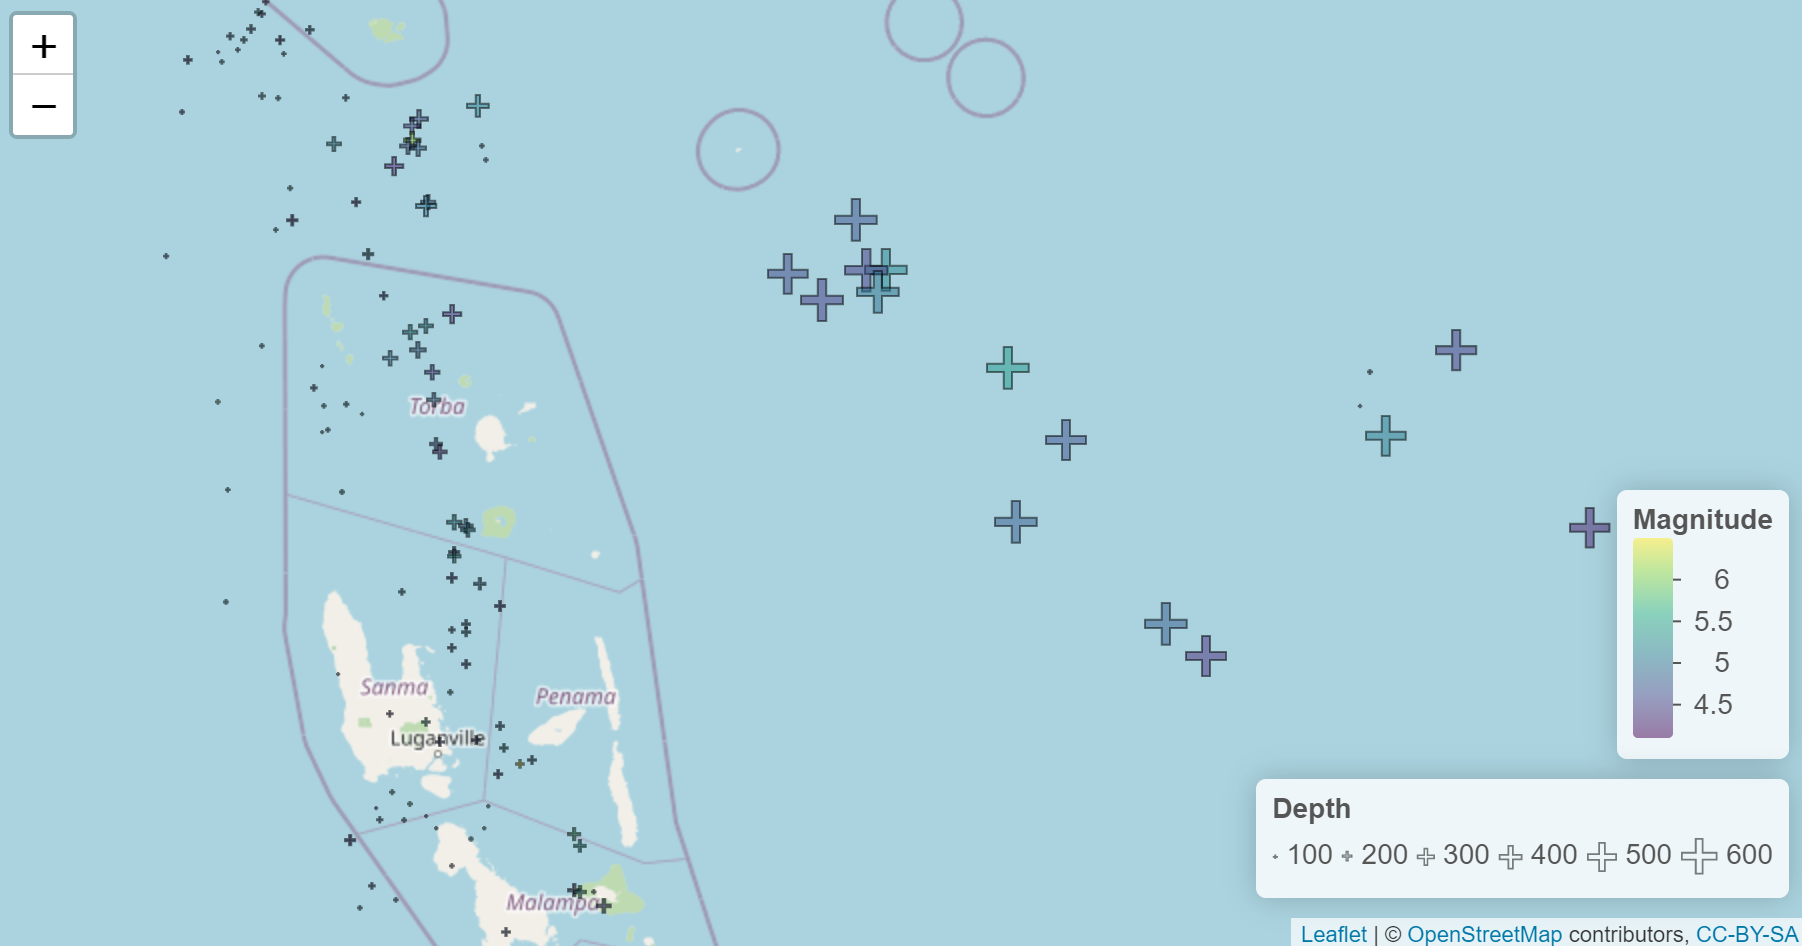
Split Color and Size Encodings
It is also possible to color encode and size encode with different values. Using a palette function from the leaflet package, the color/fillColor arguments can be used to base the color encoding on a different vector of data than the values argument which is for size.
numPal <- colorNumeric('viridis', quakes$mag)
leaflet(quakes) %>%
  addTiles() %>%
  addSymbolsSize(values = ~depth,
                 lat = ~lat,
                 lng = ~long,
                 shape = 'plus',
                 color = 'black',
                 fillColor = ~numPal(mag),
                 opacity = .5,
                 baseSize = 10) %>%
  addLegendSize(
    values = quakes$depth,
    color = 'black',
    title = 'Depth',
    shape = 'plus',
    orientation = 'horizontal',
    opacity = .5,
    fillOpacity = 0,
    breaks = 5,
    position = 'bottomright') %>%
  addLegendNumeric(
    pal = numPal,
    title = 'Magnitude',
    shape = 'stadium',
    values = quakes$mag,
    fillOpacity = .5,
    decreasing = TRUE,
    position = 'bottomright')
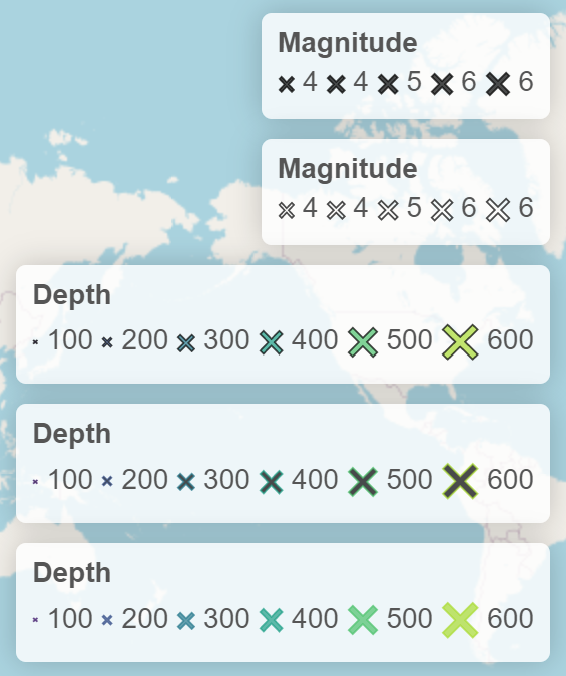
Size Legend Options
Specifying color and fillColor will override any palette function that is
provided. Below are examples of all the different configurations for the
legend. The symbols are also available for makeSizeIcons to match
the desired legend.
numPal <- colorNumeric('viridis', quakes$depth)
leaflet() %>%
  addTiles() %>%
  addLegendSize(
    values = quakes$mag,
    color = 'black',
    title = 'Magnitude',
    labelStyle = 'margin: auto;',
    shape = 'cross',
    orientation = 'horizontal',
    opacity = .7,
    numberFormat = function(x) {
     prettyNum(x, big.mark = ",", scientific = FALSE, digits = 3)},
    breaks = 5,
    position = 'topright') %>%
  addLegendSize(
    values = quakes$mag,
    color = 'black',
    fillColor = 'transparent',
    title = 'Magnitude',
    labelStyle = 'margin: auto;',
    shape = 'cross',
    orientation = 'horizontal',
    opacity = .7,
    numberFormat = function(x) {
     prettyNum(x, big.mark = ",", scientific = FALSE, digits = 3)},
    breaks = 5,
    position = 'topright') %>%
  addLegendSize(
    values = quakes$depth,
    pal = numPal,
    title = 'Depth',
    labelStyle = 'margin: auto;',
    shape = c('cross'),
    orientation ='horizontal',
    opacity = .7,
    color = 'black',
    breaks = 5,
    position = 'topright') %>%
  addLegendSize(
    values = quakes$depth,
    pal = numPal,
    title = 'Depth',
    labelStyle = 'margin: auto;',
    shape = c('cross'),
    orientation ='horizontal',
    opacity = .7,
    fillColor = 'black',
    breaks = 5,
    position = 'topright') %>%
  addLegendSize(
    values = quakes$depth,
    pal = numPal,
    title = 'Depth',
    labelStyle = 'margin: auto;',
    shape = c('cross'),
    orientation ='horizontal',
    opacity = .7,
    breaks = 5,
    position = 'topright')