One minute
fitur 0.5.25 Release
-
Fixed appearance of plots
-
Added plot_density function for comparison pdfs of fitted functions
-
Updated argument naming conventions
fitur on CRAN
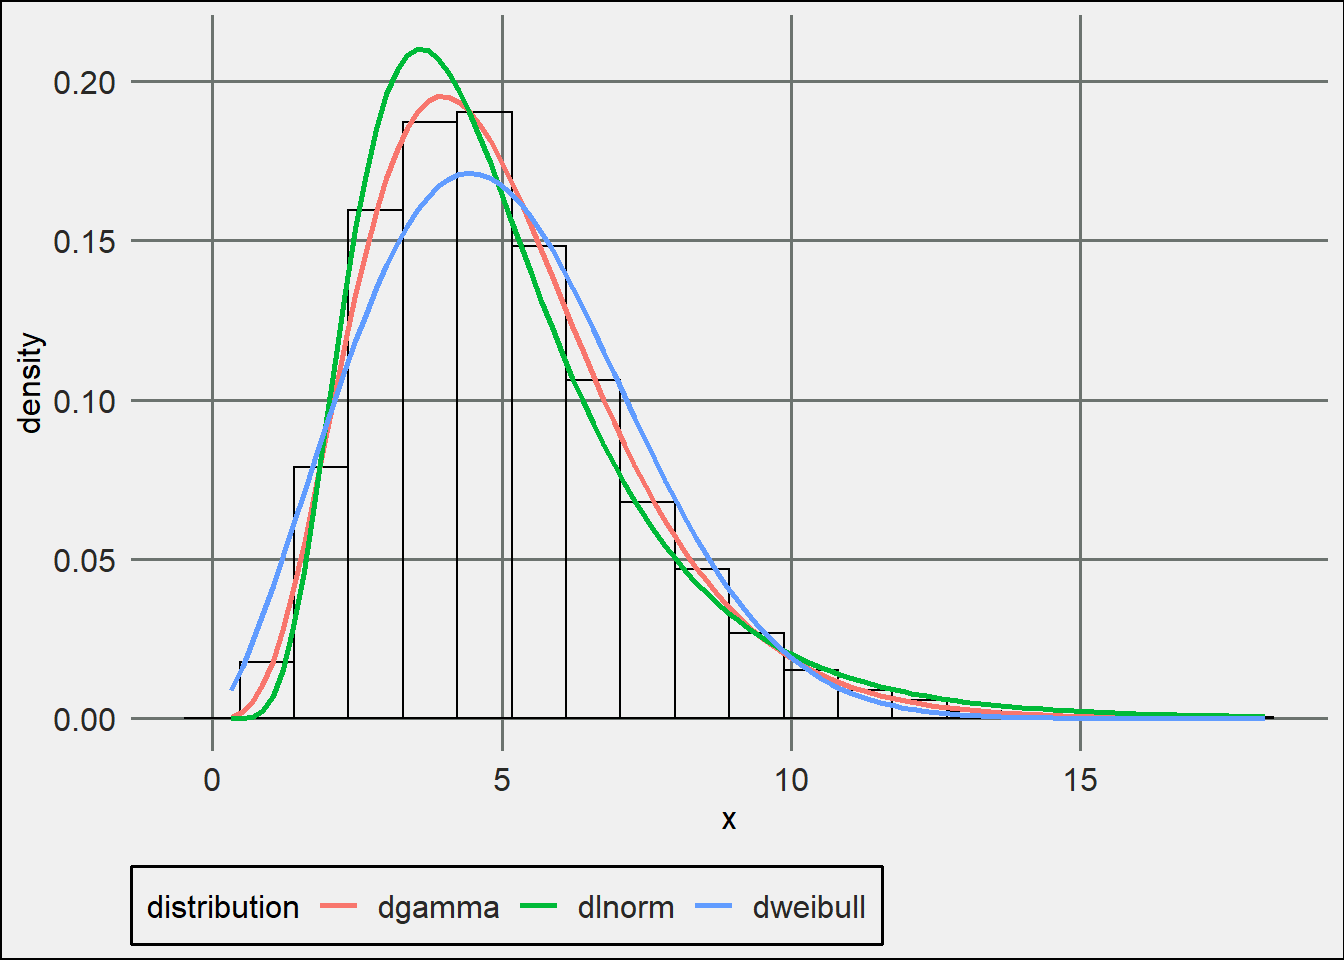
Density Diagnostic Plot
library(fitur)
## Warning: replacing previous import 'vctrs::data_frame' by 'tibble::data_frame'
## when loading 'dplyr'
library(ggplot2)
library(trstyles)
set.seed(37)
x <- rgamma(10000, 5)
dists <- c('gamma', 'lnorm', 'weibull')
fits <- lapply(dists, fit_univariate, x = x)
theme_set(theme_tr())
plot_density(x, fits, nbins = 20)
QQ-Plot
The output is a ggplot object so you can add colors, styling, etc.
plot_pp(x, fits) +
  scale_color_tr()
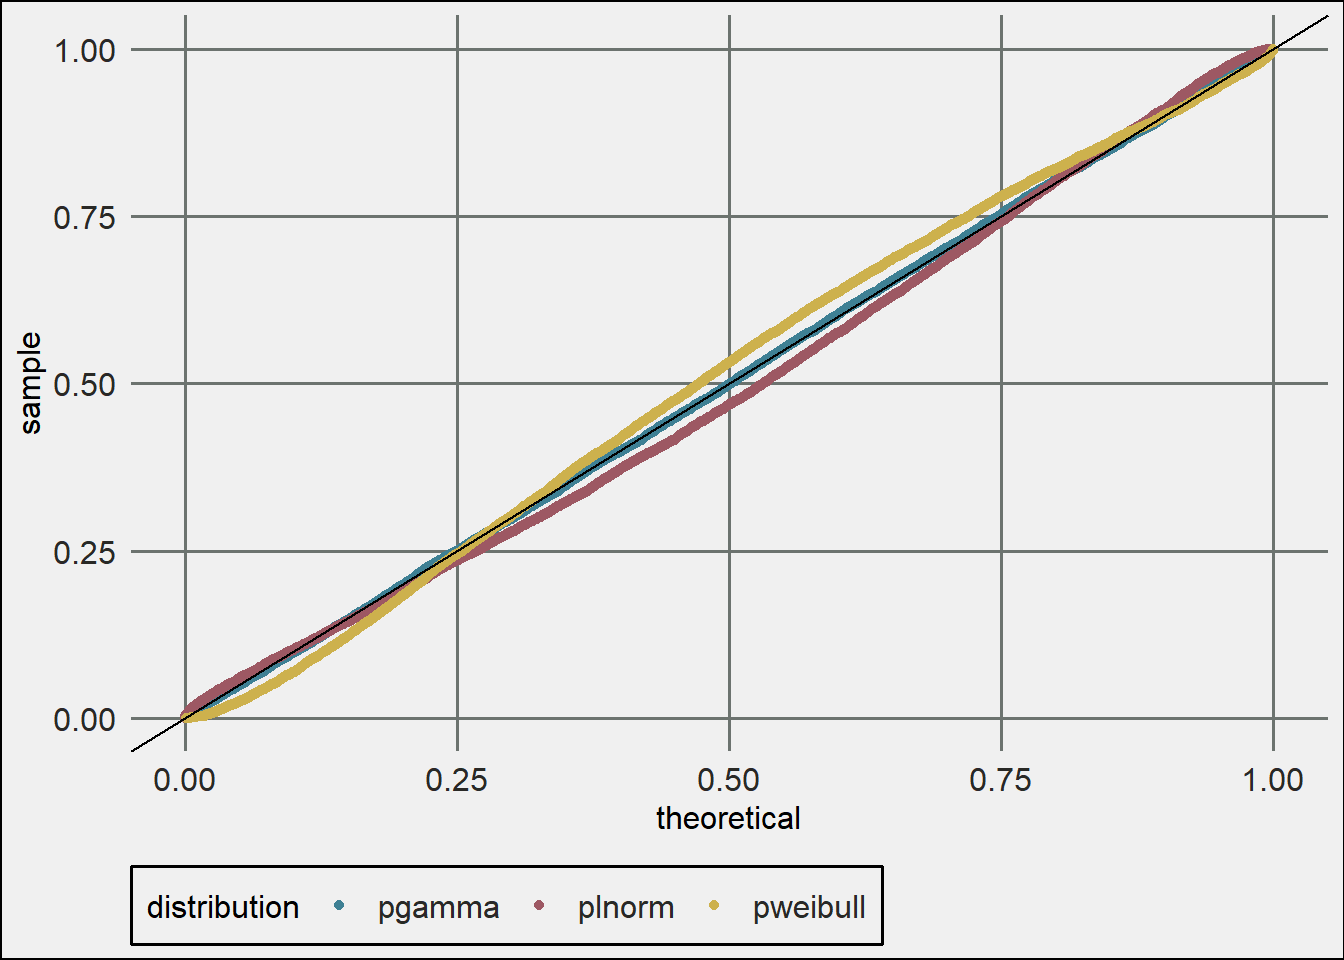
PP-Plot
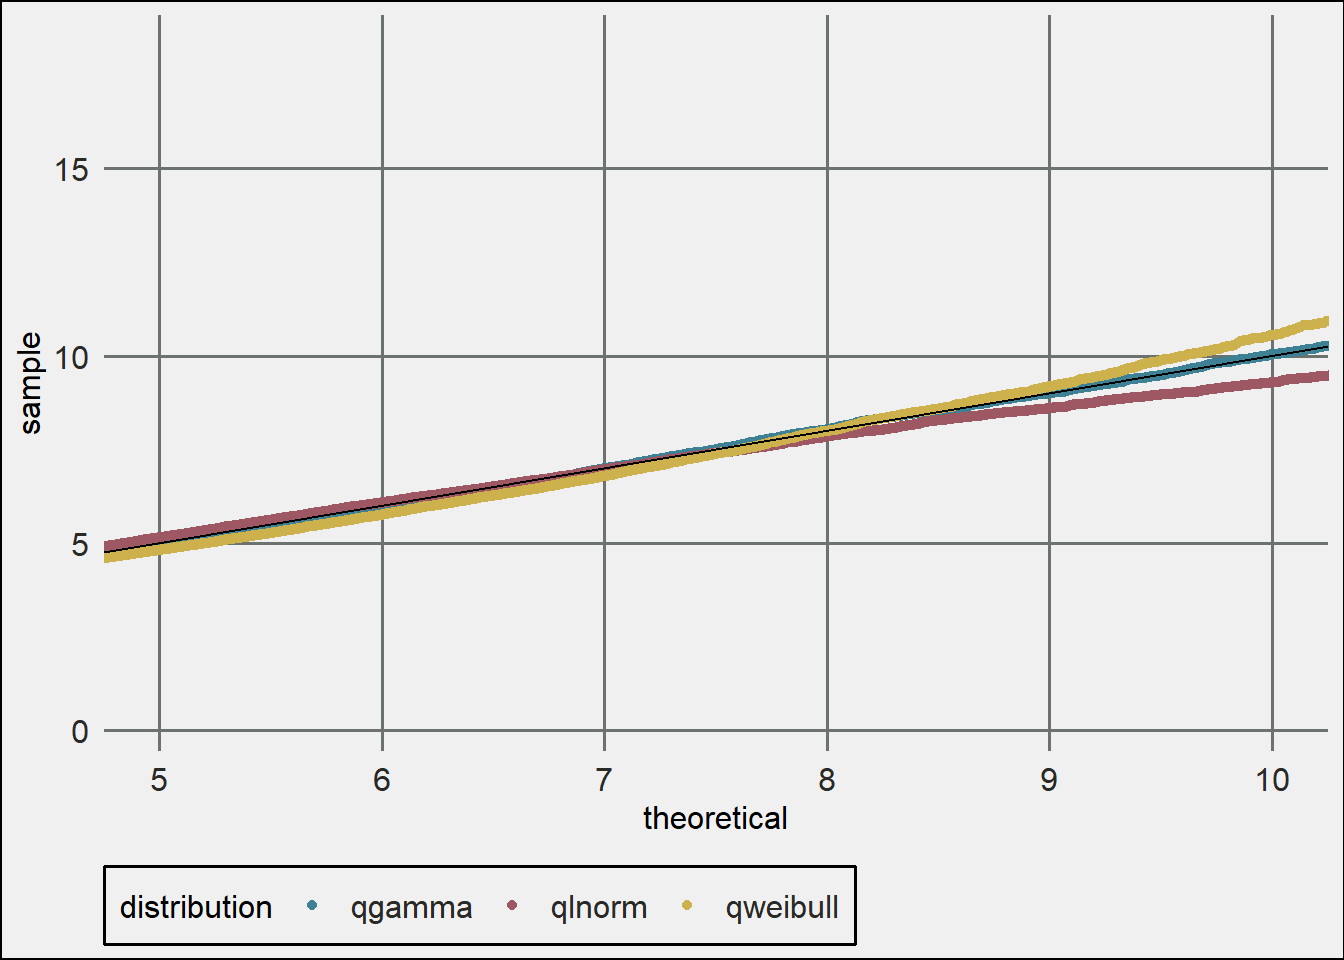
You can also zoom in on different areas.
plot_qq(x, fits) +
  scale_color_tr() +
  coord_cartesian(xlim = c(5,10))